Grafana ServerLess Monitoring
This Self-Service from ANDES enables automated creation of Grafana dashboards with alerts to monitor serverless services. Through a Terraform Cloud-driven workflow, users can generate dashboards and configure alerts without manual intervention. The user only needs to click the "Create" button, complete a form with the required information (mostly with default values), and in approximately one minute the dashboard is deployed in Grafana Cloud, linked to Cloud Run metrics. Additionally, the interface lists monitored entities, showing the service name, the dashboard URL (if it has already been created), the Grafana folder where it is stored, the responsible team, and the contact point. This Self-Service optimizes serverless service monitoring by enabling fast, standardized observability configuration without manual setup in Grafana.
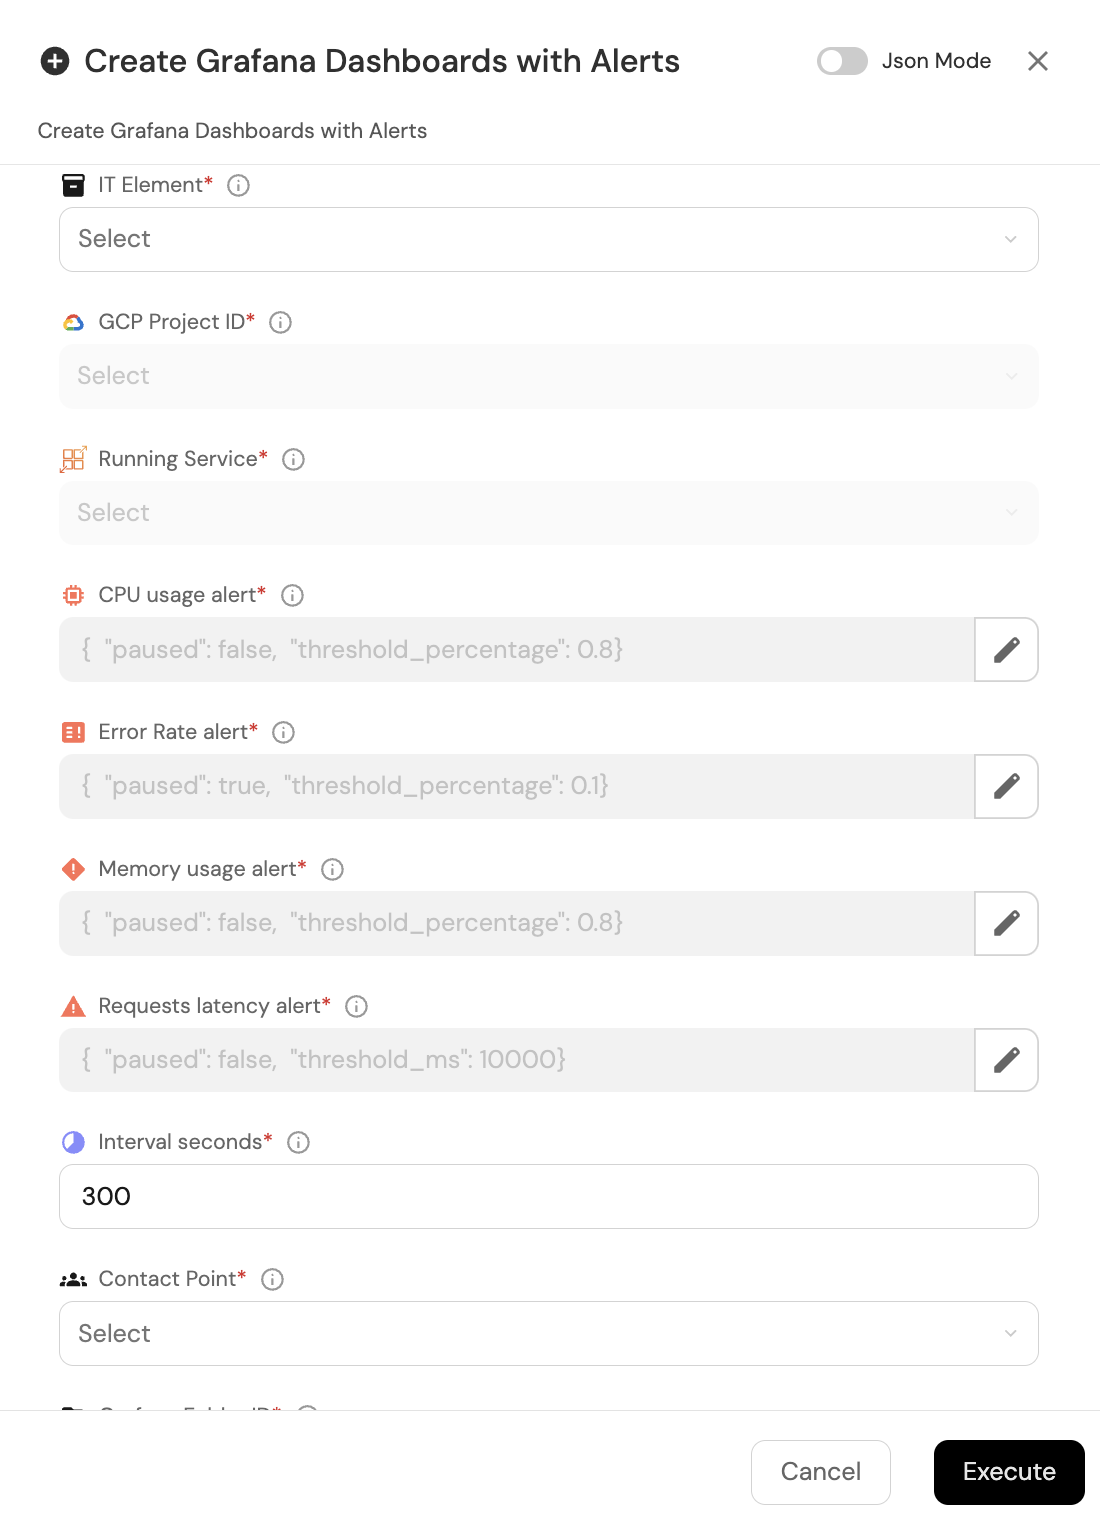
- IT Element:
- GCP Project ID:
- Running Service:
- CPU usage alert (production environment only): Service CPU usage; it is recommended that this value does not exceed 80% usage.
- Request Count alert (production environment only): Number of requests the service receives; it is recommended that this value does not exceed 1000 requests per minute.
- Error Rate alert (production environment only): Service error rate; it is recommended that this value does not exceed a 5% error rate.
- Memory usage alert (production environment only): Service memory usage; it is recommended that this value does not exceed 80% usage.
- Request latency alert (production environment only): Service request latency; it is recommended that this value does not exceed 200ms.
- Interval seconds: How often the check will run.
- Contact Point: Contact configuration for receiving alerts; this must be created in Grafana.
- Grafana Folder ID: The default folder should be selected.
🔍 Requirements and Limitations
📋 Prerequisites
- Membership in a Squad in Port
- Assigned IT Elements
- Configured environments
- Running Services available in Port
- Contact Point created in Grafana
- Folder created in Grafana
⚠️ Current Limitations
- Functionality available only for Cloud Run
- Alerts are only created in Production environments
- Only 4 alerts are created (CPU usage, Error Rate, Memory usage, and Request latency)